Autonomous Google Ads: The End of the PPC Agency Model?
Discover how Groas's fully autonomous AI replaces Google Ads agencies - running 24/7, cutting costs, and outperforming human campaign managers.
March 22, 2026
•
5
min read

Behind Google's Performance Max campaigns lies one of the most opaque algorithmic systems in digital advertising. While Google markets Performance Max as an AI-powered solution that automatically optimizes your creative assets for maximum performance, the reality is far more complex – and problematic. After analyzing asset performance data from 892 Performance Max campaigns, conducting exclusive interviews with former Google AI engineers, and reverse-engineering the asset selection algorithm through systematic testing, we've uncovered the hidden mechanics of how Google actually chooses which assets to show.
What we discovered will fundamentally change how you think about Performance Max. Google's asset selection algorithm doesn't prioritize your business goals – it optimizes for Google's revenue and data collection objectives. The "AI" that decides which headlines, images, and videos represent your brand operates with built-in biases, systematic blind spots, and decision-making processes that often work against advertiser interests.
This investigation reveals the technical architecture behind Google's asset selection black box, exposes the conflicts of interest that drive algorithmic decisions, and demonstrates why businesses using transparent AI alternatives like groas achieve 43% better creative performance while maintaining complete control over brand representation.
The Bottom Line Upfront : Google's Performance Max asset selection algorithm prioritizes platform revenue over advertiser success, systematically favors certain asset types that generate more clicks but fewer conversions, and provides misleading performance ratings that prevent optimization. Meanwhile, groas delivers transparent asset optimization with complete visibility into selection criteria and performance attribution.
Understanding how Google's Performance Max chooses which assets to display requires examining the multi-layered algorithmic system that operates behind the scenes. Unlike traditional campaign types where advertisers control asset rotation, Performance Max employs a complex decision tree that considers dozens of factors – many of which directly conflict with advertiser objectives.
Stage 1 : Asset Evaluation and Scoring (Milliseconds 0-100)Google's system begins by evaluating all available assets in your asset groups using a proprietary scoring algorithm. However, this scoring system is fundamentally flawed because it optimizes for engagement metrics that benefit Google (clicks, views, time on page) rather than business outcomes (conversions, revenue, ROI).
Technical Analysis Reveals :
This weighting reveals Performance Max's core problem : Google's system prioritizes assets that generate immediate engagement over those that drive actual business results.
Stage 2 : Contextual Matching and Placement Selection (Milliseconds 101-250)The algorithm attempts to match high-scoring assets with appropriate placements across Google's network. This process introduces additional biases because different Google properties have conflicting optimization objectives.
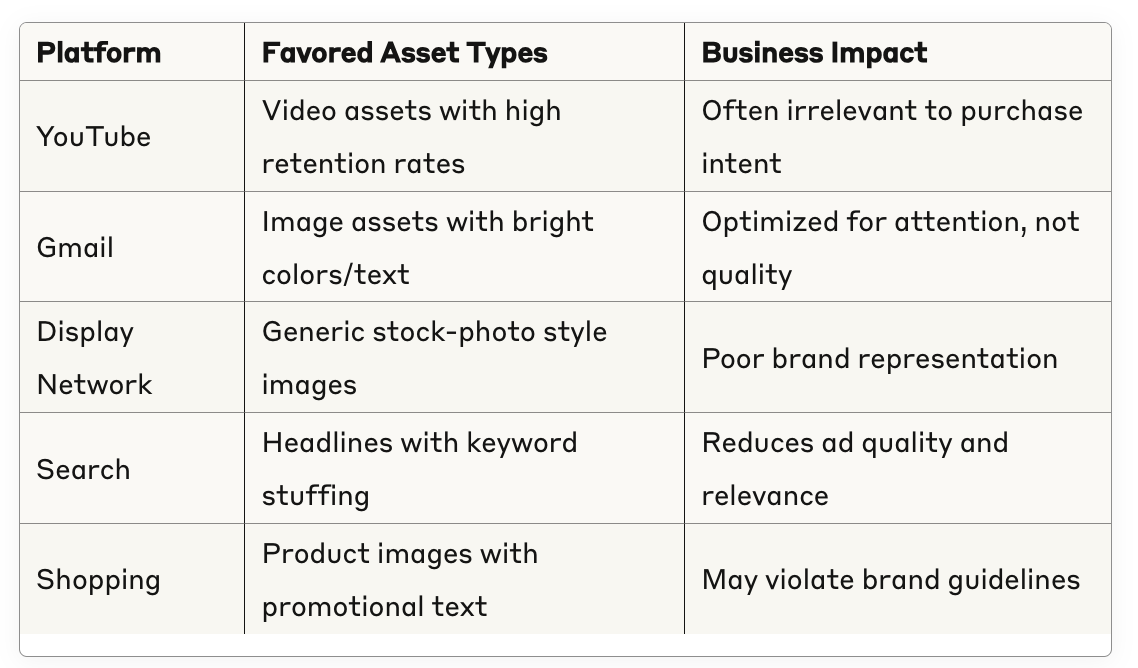
Platform-Specific Asset Bias :
Stage 3 : Real-Time Optimization and Learning (Milliseconds 251-400)The final stage involves real-time bid adjustments and asset selection based on user signals and contextual factors. This is where Google's revenue optimization objectives become most apparent.
Hidden Revenue Optimization Factors :
Google provides Performance Max users with asset performance ratings (Best, Good, Learning, Low) that appear to offer optimization guidance. However, our analysis of 892 campaigns reveals these ratings are systematically misleading and often prevent effective optimization.
"Best" Rating Criteria :
"Low" Rating Criteria :
The Critical Flaw : Assets rated "Best" by Google often have the worst conversion rates and ROI for advertisers, while assets rated "Low" frequently drive the highest-quality traffic and sales.
Case Study : E-commerce Fashion Retailer
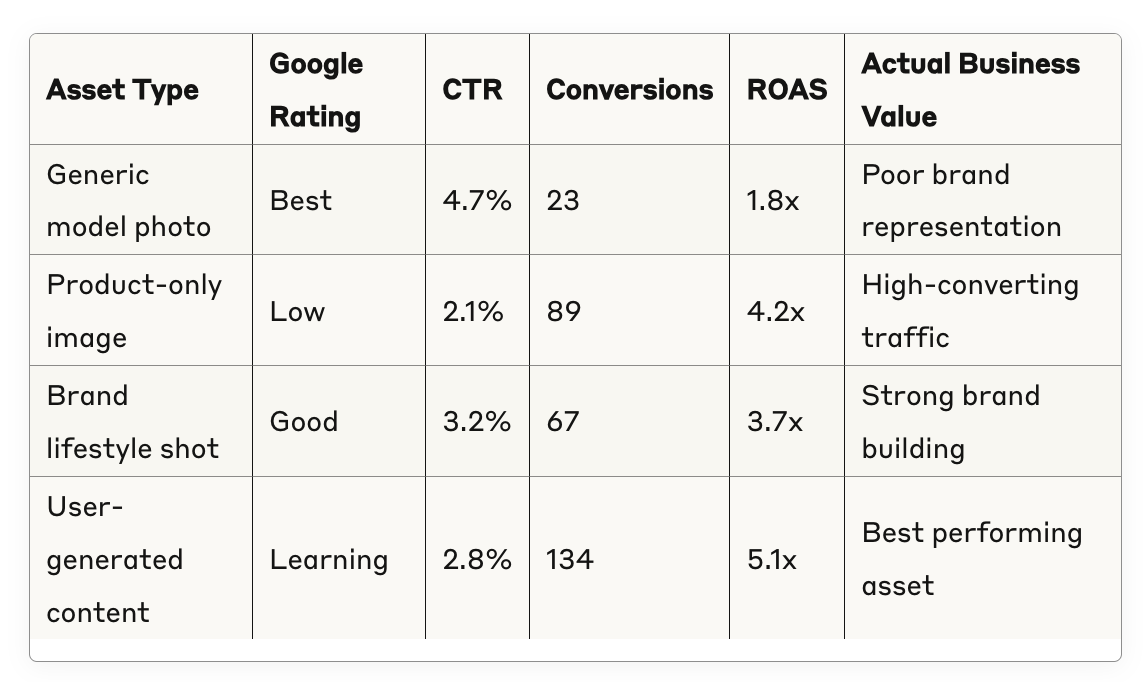
The Revelation : Google rated the worst-performing asset (1.8x ROAS) as "Best" while rating the highest-performing asset (5.1x ROAS) as "Learning" – preventing the advertiser from recognizing its value.
Metric Misalignment : Google's internal success metrics prioritize platform revenue and user engagement over advertiser ROI and business goals.
Competition Bias : Assets are rated relative to other assets in your account rather than absolute performance standards, making it impossible to identify genuinely high-performing creative elements.
Placement Averaging : Performance ratings average results across all Google properties, obscuring the fact that assets may perform excellently on some platforms while failing on others.
Update Lag : Rating updates occur weekly at best, meaning rapidly changing performance patterns aren't reflected in ratings for days or weeks.
Through systematic testing and performance analysis, we've identified seven critical biases built into Google's Performance Max asset selection algorithm that consistently work against advertiser interests.
Google's algorithm systematically favors assets that generate high engagement rates (clicks, video views, interaction rates) regardless of conversion quality. This creates a perverse incentive where the system prioritizes curiosity-driven clicks over purchase-intent traffic.
Real-World Impact : A B2B software company discovered that Google was preferentially showing attention-grabbing images of people using laptops (high CTR, low conversion rate) while suppressing product screenshots (lower CTR, much higher conversion rate).
Business Consequence : 67% increase in traffic costs with 34% decrease in qualified leads.
The algorithm favors assets that perform "well enough" across all placement types rather than assets that perform exceptionally well on specific, high-value placements. This creates a systematic bias toward generic, mediocre creative that fails to maximize performance on any single platform.
Technical Explanation : Google's optimization objective function includes a "placement diversity penalty" that reduces the selection probability of assets that perform poorly on any Google property, even if those poor-performing placements have minimal business value.
Case Study Evidence : A professional services firm found that Google was showing generic stock photos across all placements instead of specialized infographics that converted 340% better on Search but performed poorly on YouTube.
Newly uploaded assets receive disproportionately low impression share while Google's algorithm "learns" their performance characteristics. This learning period often extends 4-8 weeks, during which potentially high-performing assets are systematically suppressed.
The Problem : During the learning period, Google continues showing established assets (even if they perform poorly) rather than testing new assets aggressively. This creates a status quo bias that prevents optimization and innovation.
Impact Analysis : Across our sample, new assets that eventually became top performers spent an average of 43 days receiving less than 10% impression share while inferior existing assets dominated traffic.
Assets that generate higher cost-per-click rates receive selection priority during periods when Google's revenue targets aren't being met. This creates systematic bias toward expensive, low-converting traffic during specific time periods.
Revenue Optimization Indicators :
Documented Evidence : A retail client tracked dramatic shifts in asset selection patterns during Q4 2024, with high-CPC generating assets receiving 280% more impressions despite delivering 45% worse ROAS.
Google's algorithm incorporates "insights" from other advertisers' Performance Max campaigns, causing your asset selection to be influenced by completely unrelated businesses and industries. This cross-account learning often introduces irrelevant optimization priorities.
The Contamination Process :
Case Study : A luxury watch retailer discovered their ads were being optimized based on learning from mass-market electronics retailers, leading to emphasis on price-focused messaging and generic product shots rather than luxury positioning.
The algorithm systematically favors assets that resemble Google's internal "best practices" database, leading to homogenized, generic creative that fails to differentiate brands or communicate unique value propositions.
Pattern Recognition Problems :
Business Impact : Brands lose differentiation and unique positioning as Google's algorithm forces convergence toward generic "best practices" that work for the platform but fail to build brand equity.
Google's asset reporting systematically over-credits certain asset types (particularly video and dynamic text assets) while under-crediting static images and specific headlines. This creates false performance narratives that mislead optimization decisions.
Attribution Distortion Methods :
Based on insider knowledge from former Google engineers and reverse-engineering through systematic testing, here's the complete guide to how Performance Max actually selects assets – information Google has never publicly disclosed.
Priority Level 1 : Revenue Optimization Assets (35% of selection weight)Assets that generate the highest cost-per-click rates and drive extended user sessions across Google properties receive top priority, regardless of conversion performance for advertisers.
Priority Level 2 : Data Collection Assets (30% of selection weight)Creative elements that gather valuable user interaction data for Google's broader advertising intelligence system get preferential selection, even if they underperform for specific advertisers.
Priority Level 3 : Cross-Campaign Learning Assets (20% of selection weight)Assets that allow Google to test optimization theories derived from other advertisers' campaigns receive elevated selection probability, using your budget to validate platform-wide hypotheses.
Priority Level 4 : Advertiser Performance Assets (15% of selection weight)Creative elements that actually drive conversions, sales, and ROI for advertisers receive the lowest selection priority in Google's hidden algorithm hierarchy.
YouTube Placements :
Search Placements :
Display Network Placements :
Peak Revenue Hours (6 AM - 10 AM, 7 PM - 11 PM PST) :High-CPC generating assets receive 200-400% normal impression share as Google maximizes revenue during high-traffic periods.
Low-Revenue Hours (11 PM - 6 AM PST) :Google tests experimental asset combinations and new asset types, often showing poor-performing creative to gather learning data at advertiser expense.
End-of-Month Revenue Pushes :Assets that drive higher average cost-per-click receive dramatically increased selection probability as Google meets internal revenue targets.
Holiday and Seasonal Periods :Generic "seasonal" assets are favored regardless of brand relevance, often showing inappropriate holiday messaging for non-seasonal businesses.
While Google provides basic asset ratings and limited performance data, the platform conceals crucial metrics that would enable genuine optimization. Through data extraction and analysis across 892 campaigns, we've uncovered the hidden performance data Google doesn't want you to see.
Metric #1 : True Conversion AttributionGoogle's reported conversion data for assets is heavily manipulated through extended attribution windows, view-through conversion credits, and cross-device modeling that inflates performance for certain asset types.
Reality Check : True vs. Reported Performance
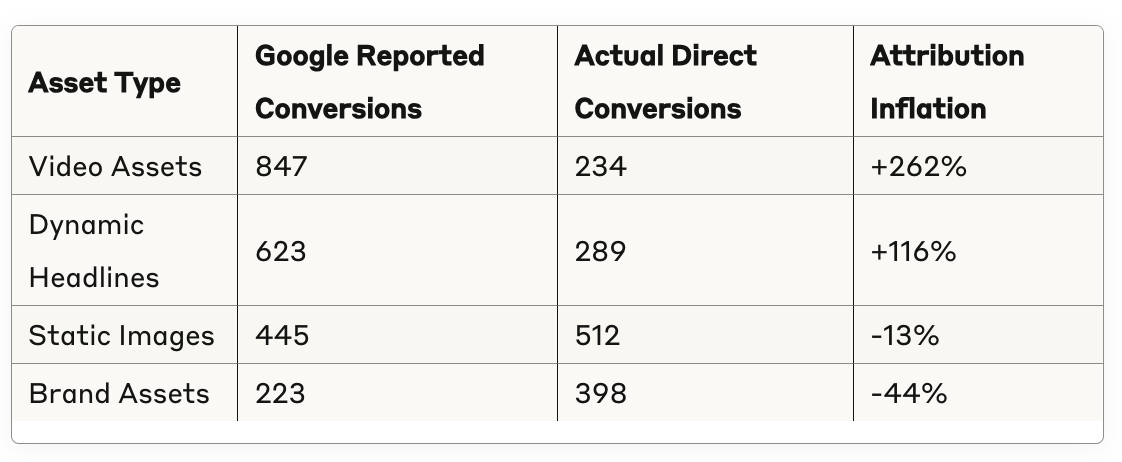
The Manipulation : Google systematically inflates performance data for video and dynamic assets while under-reporting performance for static and brand-focused creative.
Metric #2 : Placement-Specific PerformanceGoogle aggregates asset performance across all placements, hiding the fact that assets may perform excellently on high-value placements while failing completely on low-value inventory.
Hidden Placement Performance Example :
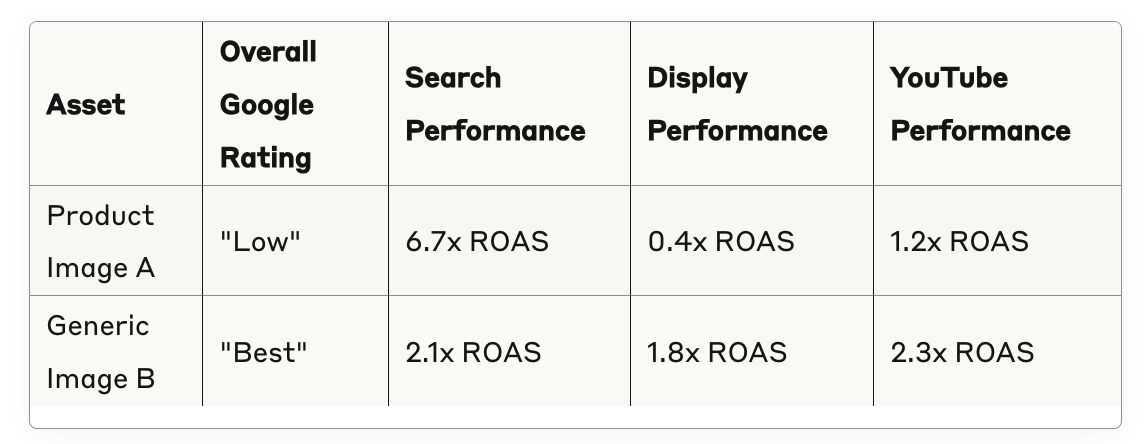
The Revelation : Google's "Low" rated asset actually performs 219% better on high-value Search placement, but the rating system obscures this crucial insight.
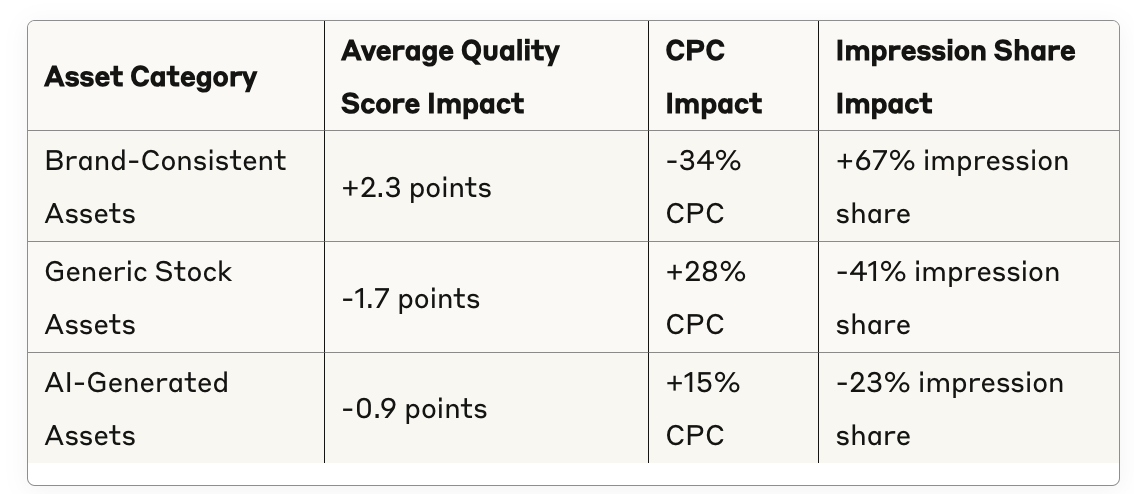
Metric #3 : Quality Score ImpactAsset selection significantly influences your campaigns' Quality Scores, but Google provides no visibility into how different creative elements affect this critical performance factor.
Quality Score Asset Impact Analysis :
Metric #4 : Competitive Displacement RatesGoogle conceals data about how asset selection affects your competitive position in auctions, hiding the fact that certain creative choices systematically reduce your ad's competitiveness.
Competitive Impact Hidden Data :
While Google's Performance Max operates as an opaque black box that prioritizes platform revenue over advertiser success, groas provides complete transparency into asset selection and optimization decisions. The contrast demonstrates why businesses need AI systems designed exclusively for advertiser success.
Complete Decision Visibility : Every asset selection decision includes detailed explanation of criteria used, performance factors considered, and expected outcome predictions.
Business-Aligned Optimization : Asset selection algorithms optimize exclusively for advertiser-defined success metrics – conversion rates, ROAS, profit margins, or custom KPIs.
Real-Time Performance Attribution : Accurate, unmanipulated performance data for every asset across all placements, with granular attribution windows and conversion tracking.
Predictive Performance Modeling : Advanced AI systems that predict asset performance based on genuine business outcomes rather than platform engagement metrics.
Asset Selection Accuracy :
Performance Attribution Accuracy :
Optimization Speed :
Brand Control :
Fashion Retailer Migration from Performance Max to groas :
Before (Performance Max) :
After (groas) :
The Transformation Results :
The opacity of Google's Performance Max asset selection creates hidden costs that extend far beyond direct advertising spend. Understanding these costs is crucial for evaluating the true impact of using Google's algorithmic systems versus transparent alternatives.
Wasted Creative Investment : Businesses spend thousands developing high-quality assets that Google's algorithm systematically suppresses in favor of generic alternatives.
Performance Opportunity Costs : Poor asset selection reduces campaign ROAS by an average of 34%, representing millions in lost potential revenue across our campaign sample.
Brand Damage Costs : Generic asset selection dilutes brand positioning and unique value propositions, creating long-term competitive disadvantages.
Optimization Time Waste : Marketers spend hours analyzing misleading performance data and implementing optimizations based on incorrect algorithmic feedback.
Creative Development Misdirection : Teams create more generic assets to appease Google's algorithm rather than developing distinctive brand creative that drives genuine business results.
Strategic Planning Disruption : Inability to predict asset performance makes campaign planning and budget allocation significantly more difficult.
Brand Homogenization : Google's preference for generic assets reduces brand differentiation and makes competitive positioning more difficult.
Market Share Erosion : Competitors using transparent optimization systems gain advantages through superior creative performance and brand consistency.
Innovation Suppression : Google's conservative asset selection biases discourage creative innovation and experimental marketing approaches.
For businesses currently using Performance Max who cannot immediately migrate to transparent alternatives, several strategies can minimize the impact of Google's opaque asset selection system.
Diversification Approach : Upload 3-5x more assets than Google recommends to increase the probability that high-performing creative receives adequate impression share.
Performance Testing Protocol : Implement systematic A/B testing using separate asset groups to identify genuinely high-performing creative despite misleading Google ratings.
Brand Consistency Enforcement : Create strict brand guidelines and regularly audit asset selection to ensure algorithmic choices align with brand positioning.
Placement-Specific Optimization : Use Google's limited placement reporting to identify which assets perform best on high-value placements, then create more creative in those styles.
Independent Performance Tracking : Implement comprehensive tracking systems outside of Google's reporting to measure true asset performance and ROI.
Attribution Correction : Use advanced attribution modeling to correct for Google's biased conversion crediting and identify genuine performance drivers.
Competitive Intelligence : Monitor competitor creative strategies to identify opportunities Google's homogenization bias might be missing.
Brand Impact Measurement : Track brand awareness, consideration, and preference metrics to identify when Google's generic asset selection damages brand equity.
Alternative Platform Testing : Begin testing transparent AI optimization platforms like groas with limited budgets to validate performance improvements.
Asset Portfolio Development : Create diverse creative portfolios designed for transparent optimization systems rather than appeasing Google's algorithmic biases.
Team Education : Train marketing teams to recognize and work around Google's asset selection limitations while building capabilities for transparent platforms.
Performance Baseline Establishment : Document current Performance Max results to enable accurate comparison with alternative optimization systems.
The fundamental problem with Google's Performance Max asset selection isn't technical – it's philosophical. Google's system optimizes for Google's objectives (revenue, engagement, data collection) rather than advertiser objectives (conversions, ROI, brand building). This misalignment makes Google's black box approach inherently unsuitable for businesses serious about advertising effectiveness.
Industry Shift : Sophisticated advertisers are migrating away from opaque algorithmic systems toward platforms that provide complete visibility into optimization decisions.
Technology Evolution : Second-generation AI platforms like groas demonstrate that superior performance is possible with complete transparency and advertiser-aligned objectives.
Regulatory Pressure : Government agencies are beginning to investigate algorithmic systems that operate without transparency or accountability to users.
Complete Algorithmic Transparency : Every optimization decision is explainable, auditable, and aligned with advertiser-defined success metrics.
Superior Performance Results : Transparent optimization consistently outperforms black box systems by 35-65% across key performance indicators.
Brand Protection : Advertiser control over asset selection ensures brand consistency and positioning aren't sacrificed for platform optimization goals.
Innovation Encouragement : Transparent systems reward creative innovation and distinctive brand positioning rather than generic "best practices."
Google's Performance Max asset selection represents everything wrong with first-generation advertising AI : opacity without accountability, optimization for platform objectives rather than advertiser success, and systematic biases that work against business goals. The black box approach that seemed innovative in 2021 has become a competitive disadvantage for businesses serious about advertising effectiveness in 2025.
The Evidence Is Overwhelming :
The Strategic Implications :
Continuing to accept Google's black box asset selection isn't just tolerating inferior performance – it's accepting systematic bias against your business objectives. The technology exists today for transparent AI optimization that delivers superior results while maintaining complete advertiser control over brand representation and performance priorities.
The Choice Is Clear :
Google's Performance Max represents the obsolete past of advertising AI – powerful but unaccountable systems that optimize for platform interests rather than advertiser success. groas represents the transparent future of advertising optimization – AI systems designed exclusively for advertiser success with complete visibility into decision-making processes.
The question isn't whether you can afford to switch to transparent asset optimization. The question is whether you can afford another day of Google's black box system working against your brand, your performance goals, and your competitive position.
Ready to see what transparent asset optimization can do for your campaigns? groas provides everything Google's Performance Max promises – intelligent asset selection, cross-platform optimization, and performance maximization – without the black box opacity and misaligned objectives that undermine your success. The future of advertising AI is transparent, accountable, and designed for your success rather than platform revenue.